


10 Analytics Every Clinic Should be Tracking with Google Analytics 4
Google Analytics 4 (GA4) is the latest evolution of Google’s web analytics platform, designed to provide a more comprehensive understanding of user behaviour across websites and apps. In today’s digital landscape, having clear insights into how people interact with your online presence is no longer a luxury—it’s a necessity for making informed business decisions and achieving sustainable growth. GA4 offers a more privacy-centric and event-based tracking model compared to its predecessor, Universal Analytics, allowing for a deeper dive into the customer journey. Starting July 1, 2023, standard Universal Analytics properties stopped processing data, making GA4 the primary tool for tracking and analysing user interactions.
However, the shift to GA4 can be a bit daunting. Its interface and reporting structure are different, and many businesses find the sheer volume of data and customisation options overwhelming. It’s easy to get lost in the possibilities without a clear focus. To set up GA4, you can create a new property or connect an existing Universal Analytics property, which simplifies the transition process.
That’s precisely what we’re aiming to achieve here. We want to cut through the noise and identify the most important analytics that aesthetic clinics should actively track in GA4. By focusing on these key metrics, clinics can gain actionable insights into their online performance, specifically in relation to attracting new patients and fostering business growth, without getting bogged down in unnecessary data. We’re pinpointing the signals that truly matter for your clinic’s success. Creating events in GA4 is simpler compared to Universal Analytics, as GA4 captures standard events automatically, reducing the need for extensive manual setup.
In this post, we’ll look at:
Here are 10 things aesthetic clinic should be tracking in Google Analytics 4
Website Traffic
Tracks the total number of potential patients visiting your clinic’s website. Higher traffic means a larger pool of individuals who could become clients.
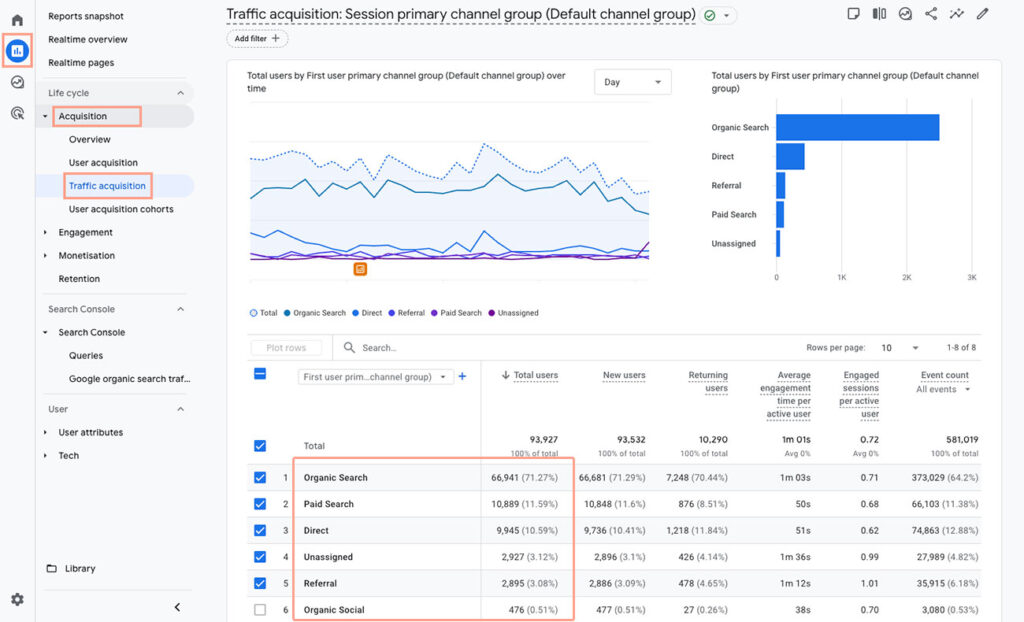
- Go to Reports on the left-hand menu. Navigate to Life cycle > Acquisition > Traffic acquisition.
- The “Users” metric at the top of the report represents the total number of unique visitors to your website within the selected date range.
Monitor this trend over time (weekly, monthly) to see if your overall online visibility is growing. Spikes might correlate with marketing campaigns.

Traffic Sources
Identifies where prospective patients are finding you online (e.g., Organic Search for “Botox Manchester”, Instagram). Knowing if they come from Google searches for specific treatments or your social media helps you focus your marketing efforts on the most effective channels for reaching your target audience.
- You’re already in Reports > Life cycle > Acquisition > Traffic acquisition.
- The table below the overview chart shows a breakdown of your website traffic by “Default Channel Group” (e.g., Organic Search, Direct, Social, Paid Search, Referral). Click on the dropdown menu above the table (it likely says “Default Channel Group”) to explore other dimensions like “Source” or “Medium” for more granular detail (e.g., specific social media platforms, referring websites).
Analyse which sources are driving the most traffic. If “Organic Search” is high, optimise your website for relevant keywords like “Botox in London”. If social media is strong, focus on engaging content there. Identify underperforming channels to re-evaluate your strategy.
New vs. Returning Visitors
Shows the ratio of first-time visitors (potential new patients) to repeat visitors (existing patients). A strong flow of new visitors indicates successful patient acquisition strategies, while a high number of returning visitors highlights good retention.
- Go to Reports > Life cycle > Engagement > Overview. Alternatively, you can customise the Traffic acquisition report. Look for the “New vs. Returning visitors” card in Engagement Overview. It provides a quick snapshot.
- In the Traffic acquisition report, click the “+” icon next to any of the existing columns in the table. Search for and select “User Type.” This will add a column showing whether each session was from a “New” or “Returning” visitor.
A healthy clinic will see a good mix. A high number of new visitors indicates successful acquisition efforts. Tracking returning visitors helps gauge patient loyalty and the effectiveness of follow-up marketing.

Bounce Rate (on Treatment Pages):
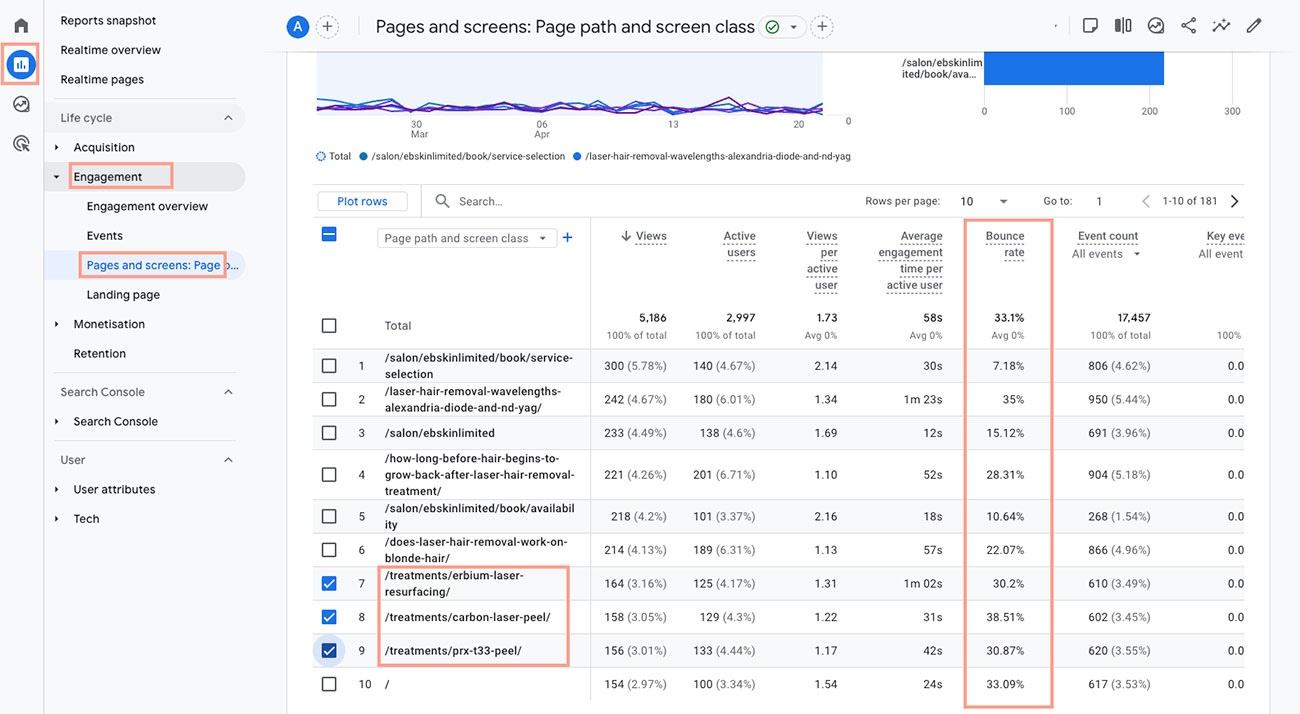
Measures the percentage of potential patients who leave a treatment page (like “Dermal Fillers”) after viewing only that page. A high bounce rate suggests the page might not be engaging or providing the information they need, hindering inquiries and bookings. In GA4, Bounce Rate is defined as the percentage of sessions that were not engaged, lasting less than 10 seconds or involving only one page view.
- Go to Reports > Life cycle > Engagement > Overview or Reports > Life cycle > Engagement > Pages and screens. You can also add this as a metric to the Traffic acquisition report. Under the Engagement overview tab, look for the “Bounce rate” metric in the overview cards.
- Pages and Screens – This report shows the bounce rate for individual pages. Focus on key treatment pages.
- Traffic Acquisition Customisation – In the Traffic acquisition report, click “Customise report” in the top right. In the “Metrics” section, add “Bounce rate.” Click “Apply.”
A high bounce rate on service pages might mean the content isn’t compelling or doesn’t answer potential patients’ questions. Investigate these pages to improve content, calls-to-action, and user experience.
Average Session Duration
Indicates how long potential patients spend reading about your treatments and services. Longer engagement suggests they are interested and researching, increasing the likelihood of them contacting you.
- Similar to Bounce Rate, find this in Reports > Life cycle > Engagement > Overview or Reports > Life cycle > Engagement > Pages and screens. You can also add it to the Traffic acquisition report.
- Engagement Overview – Look for the “Average engagement time per session” metric.
- Pages and Screens – This report shows the average engagement time for individual pages.
- Traffic Acquisition Customisation – In the Traffic acquisition report customisation, add the “Average engagement time per session” metric.
Longer session durations on service and “About Us” pages suggest visitors are actively consuming information. Low durations might indicate they aren’t finding what they need quickly.

Pages Per Session
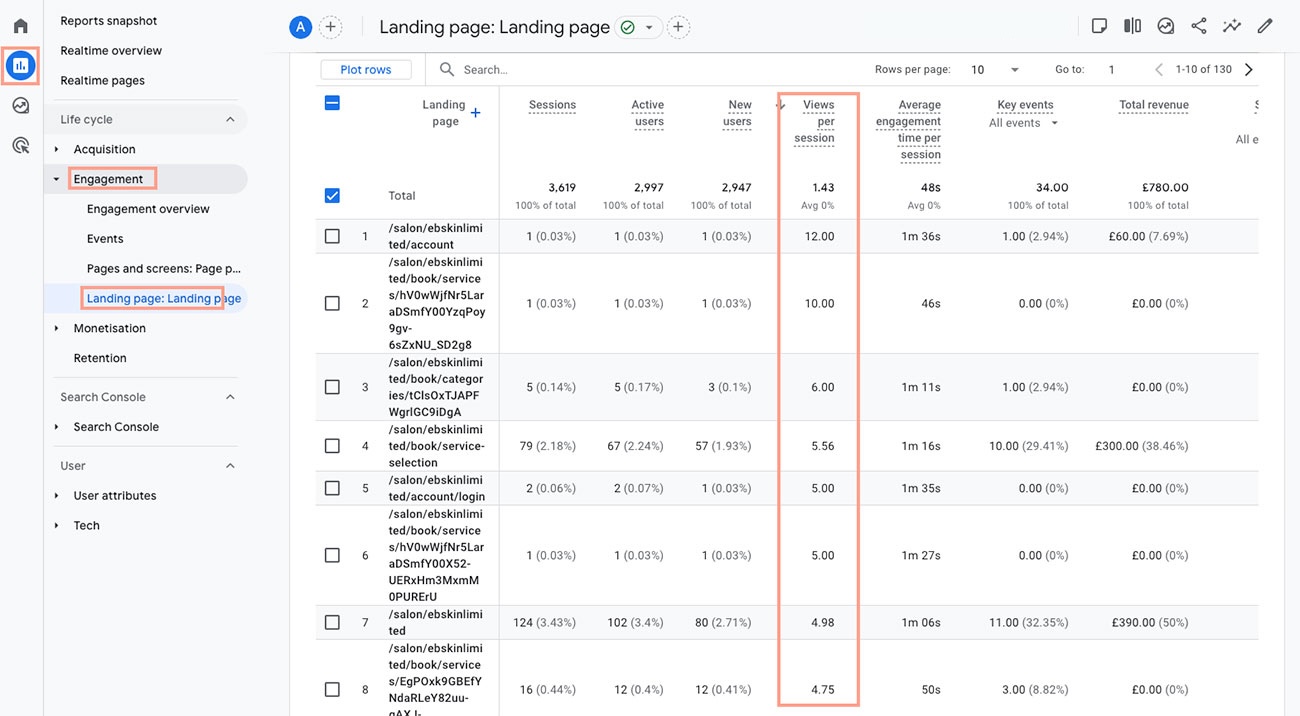
Shows how many pages a potential patient views in one visit. E.g., Visiting “About Us,” then “Treatments,” then “Contact”. Exploring multiple pages suggests a higher level of interest and a greater chance of them reaching out for a consultation or booking.
- Found in Reports > Life cycle > Engagement > Overview or Reports > life cycle > Engagement > Pages and screens. Also available for customisation in Traffic acquisition.
- Engagement Overview – Look for the “Pages / session” metric.
- Pages and Screens – This report shows the average number of pages viewed per session.
- Traffic Acquisition Customisation – Add the “Pages / session” metric in the report customisation.
A higher number indicates users are exploring multiple aspects of your clinic, which is a positive sign of interest. Ensure your website has a clear and intuitive navigation to encourage this exploration.
Goal Completions
Directly tracks how many website visitors take the desired action of contacting you or booking an appointment (e.g., “Request a Consultation” Form Submissions, Online Appointment Bookings). This is a key indicator of your website’s effectiveness in converting interest into tangible leads and appointments. In Google Analytics 4, events can be anything from clicking a link to filling out a form, making it a versatile tool for tracking user interactions.
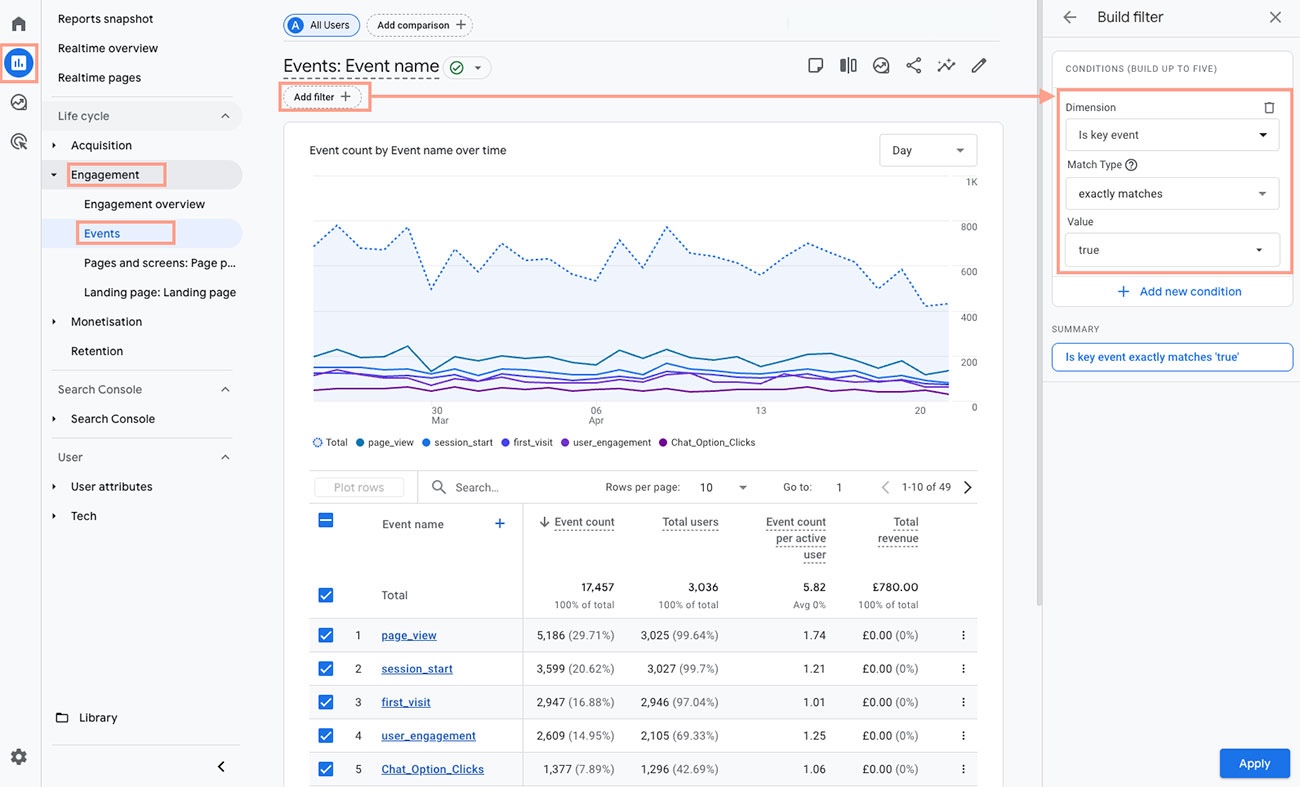
- You need to configure these as Key Events in GA4. Go to Admin (gear icon in the bottom left) > Data display > Conversions (note the section is still labeled “Conversions,” but you’ll be marking events as key events) > New key event.
- How to Track Contact Form – You’ll likely either choose an existing event (if GA4 is already tracking form submissions, often as form_submit) and mark it as a key event, or you’ll create a new key event by manually entering the name of the event that signifies a form submission (this often requires setup in Google Tag Manager). Name the key event something like “Contact Form Submission.”
- How to Track Appointment Bookings – Similar to contact forms, identify the event that signifies a successful appointment booking (either an existing one or a custom one you’ve set up). Mark this event as a key event and name it appropriately, like “Appointment Booking.”
- Reporting – Once set up, you can see the number of times these key events occur in Reports > Life cycle > Engagement > Events. You can also see which traffic sources led to these key events in the Traffic acquisition report by adding the key event metrics as columns.
These are direct indicators of leads and potential new patients. Monitor which marketing channels and website pages are driving the most goal completions.

Conversion Rate
The percentage of website visitors who submit a consultation request form or book online. A higher conversion rate means your website is effectively turning website traffic into potential patients.
- This isn’t a standard metric in GA4, so you’ll need to calculate it.
- Track the total number of website visitors (as described in point 1) for a specific period.
- Track the number of “Conversion” goal completions (as described in point 7) for the same period.
- Divide the number of conversion by the total number of visitors and multiply by 100 to get the percentage.
This metric directly shows how effective your website is at turning visitors into potential patients seeking consultations. Monitor this rate and look for ways to improve it through website optimisation.
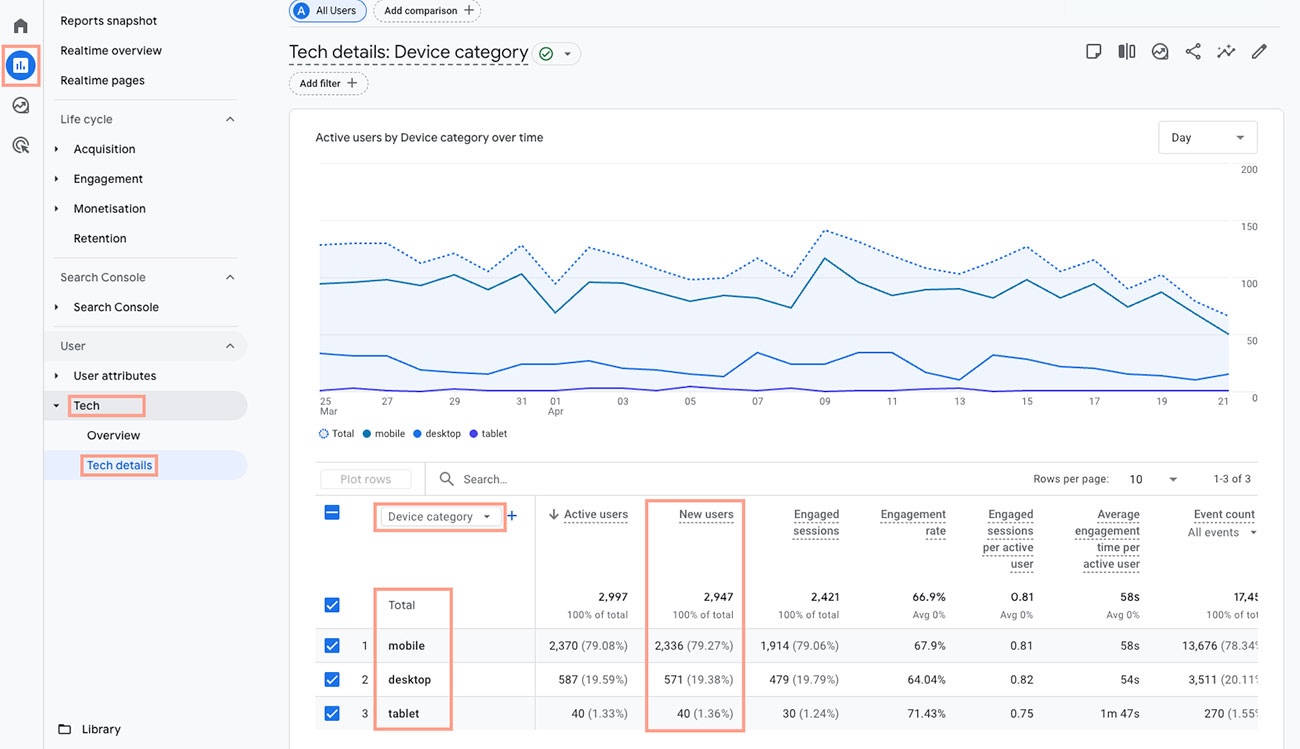
Device Type (Mobile vs. Desktop):
Reveals whether potential patients are primarily using mobile devices or desktops to browse your services. This informs your website’s mobile-friendliness and where you should focus your user experience optimisation efforts to ensure easy access and booking for all users.
- Go to Reports > Tech > Overview or Reports > Tech > Tech details. Select the dimension “Device category” from the Dimension dropdown.
- The reports show the breakdown of your website traffic by device category (desktop, mobile, tablet).
Understanding the primary devices your audience uses helps you prioritise website responsiveness and mobile user experience. Ensure your booking forms and information are easily accessible on all devices.
Key Landing Pages Performance
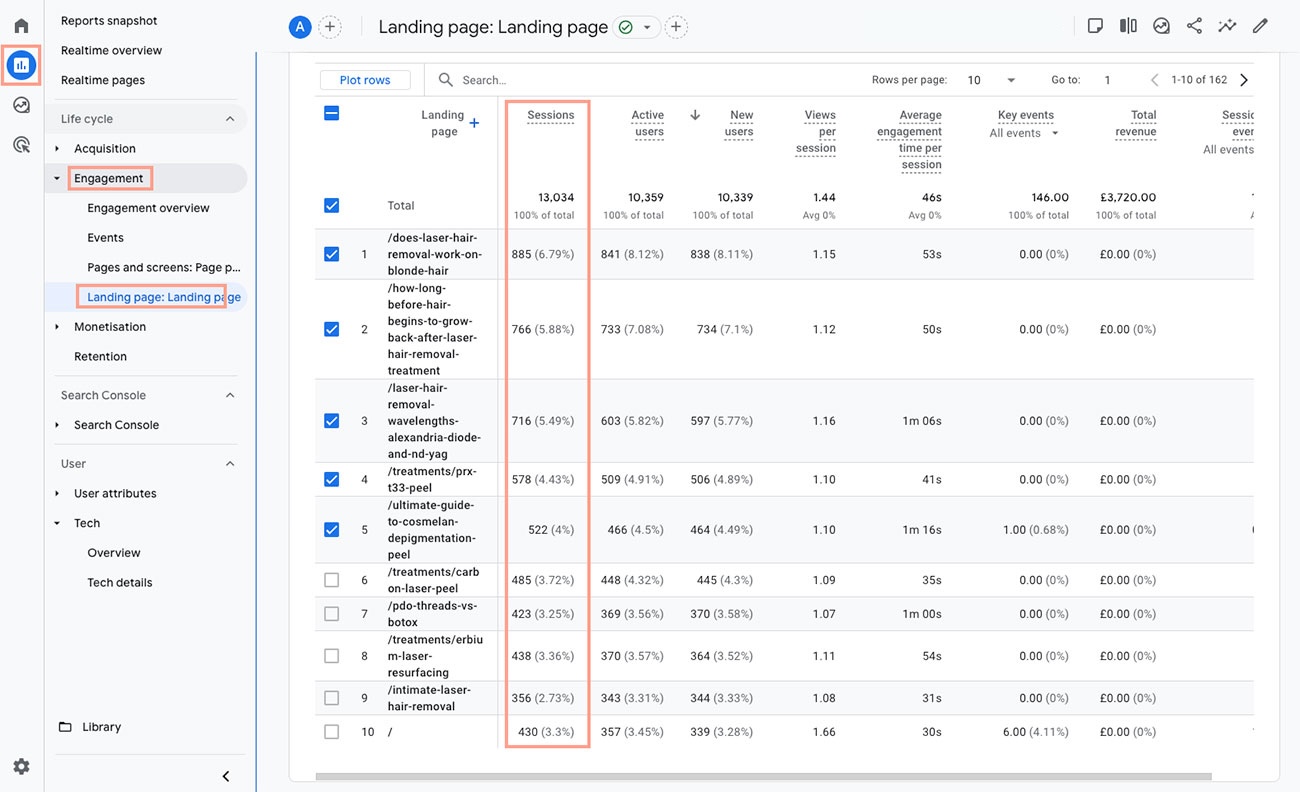
Analyses how well specific campaign landing pages (like for a limited-time promotion) are performing in attracting and converting visitors. This could also include Specific Treatment Pages. This helps you understand the ROI of your marketing campaigns and optimise future promotions for better patient acquisition.
- Go to Reports > Life cycle > Engagement > Landing page.
- This report shows various metrics for each landing page on your website, including users, engagement time, and conversions (if you’ve set them up).
Analyse the performance of specific pages you use in marketing campaigns or that highlight key treatments. Identify underperforming landing pages and optimise their content, calls-to-action, and design to improve conversion rates.
Before you start looking at the data
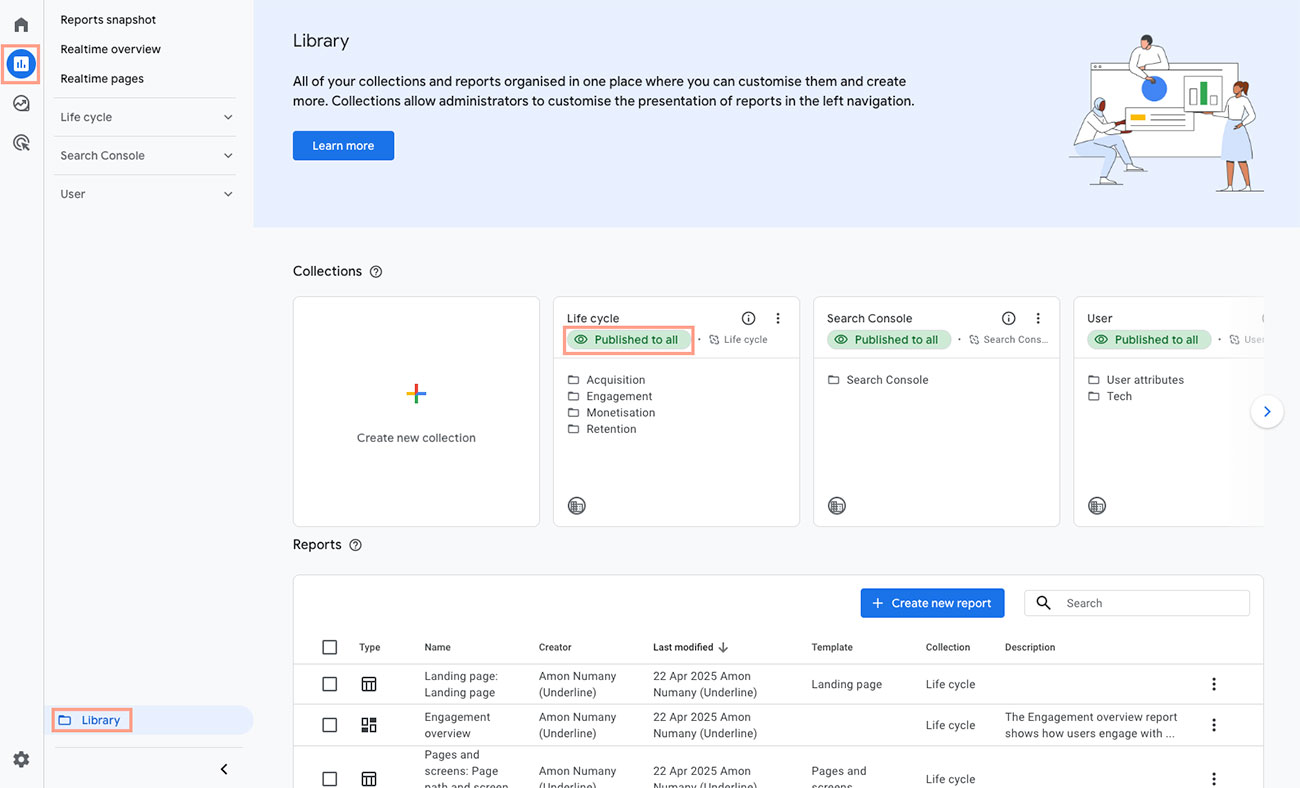
Because of the way Google Analytics 4 is designed, it often isn’t easy to find what you are looking for, especially if you haven’t setup your reporting sections properly.
Whilst following our instructions below, if you see any of the reports missing head over to Reports > Library and choose the report you want to follow.
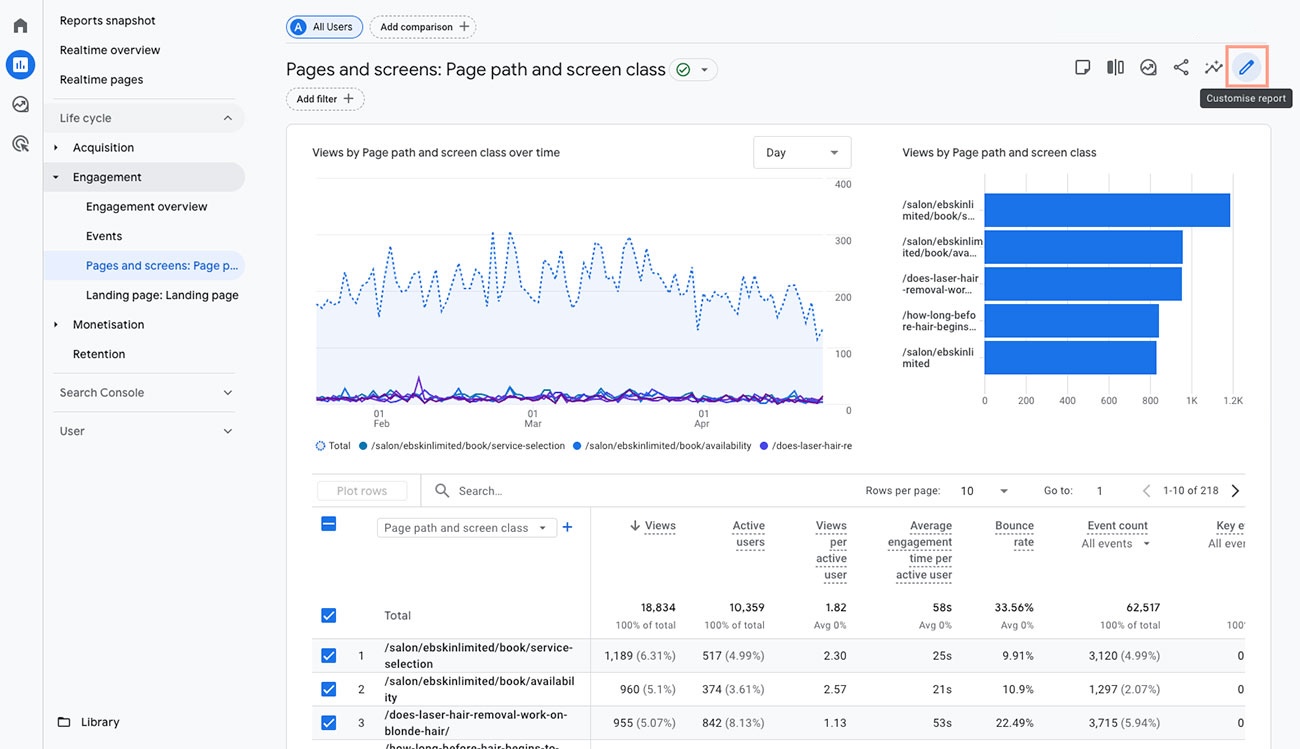
Often times you will also see that the right data isn’t being displayed. In this case you might need to customise the report to ensure the right data column is being displayed. To do this, click “Customise Report” on the top-right corner and choose the relevant data under “Metric”, click update and save it.

Additional Tips for Navigating GA4:
- Date Range: Always ensure you have the correct date range selected in the top right corner.
- Customisation: Don’t be afraid to customise reports by adding secondary dimensions and metrics to get more specific insights.
- Exploration: The “Explore” section on the left-hand menu allows for more advanced, custom analysis using techniques like free-form tables and funnel analysis. This can be very powerful for understanding user journeys towards conversion.
- Regular Monitoring: Make it a habit to check these key metrics regularly (e.g., weekly or monthly) to identify trends and react to changes in user behaviour.
- Annotations: Use the annotations feature (a small speech bubble icon in reports) to mark significant events like marketing campaign launches, website updates, or promotions. This helps you correlate these events with changes in your analytics.
By consistently tracking and analysing these GA4 metrics, your aesthetic clinic can gain a much clearer understanding of your online performance, optimise your patient acquisition strategies, and ultimately drive sustainable growth. Remember to be patient as you learn the GA4 interface, and don’t hesitate to explore the various reports and customisation options available.
